Bitcoin price broke down the bottom line of great ascending channel where Bitcoin price is in for a few months. I shared lots of analysis and pointed the importance of this great ascending channel. I was in holiday for a week and Bitcoin price broke down this great support line when I was in holiday.
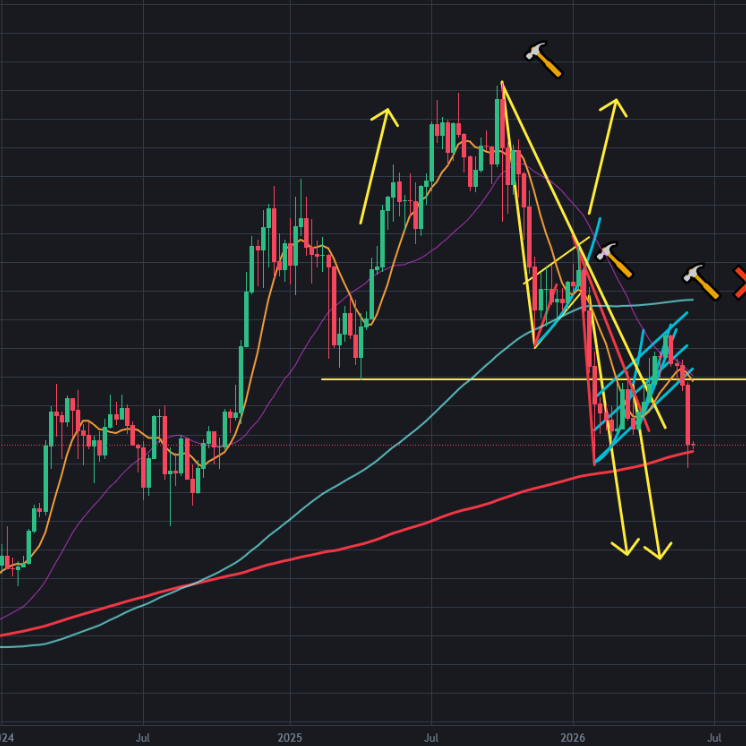
Here you can see daily chart of Bitcoin price. Bitcoin price reversed down after touching 200-day moving average. After reversing down from this level, the middle line of ascending channel was the first support line on Bitcoin price chart. It could not support Bitcoin price. The bottom level of this ascending channel tried to support Bitcoin price but It could not. After breaking the bottom line of this great ascending channel, Bitcoin price went down fast. I pointed possible market crash on Bitcoin price chart and It started. Bitcoin price broke down the last bottom level 60K USD.
We may see supporting by this level. There is possible head and shoulders pattern on Bitcoin price chart. We may see this pattern in next days. 60K should support Bitcoin price to see this pattern.

Here you can see the indicators on daily chart of Bitcoin price. Fisher Indicator is on the bottom and reversing up. MACD Indicator is below 0 level and trying to reverse up. RSI Indicator is at oversold level.
These indicator can show us that Bitcoin price may reverse up from this levle for short term. We will see price bullish action on Bitcoin price chart for short term. If we see this bullish move, this may be for the right shoulder.

This level may be the bottom on Bitcoin price chart for short time.
We will see..
Comments